Understanding Distributed Tracing in Microservices
Introduction
In a microservices architecture, requests travel across multiple services before completing a single user action. Tracking these requests across different services is crucial for debugging, monitoring performance, and optimizing system efficiency. This is where distributed tracing comes in.
Distributed tracing allows us to trace a request as it flows through different services, helping us identify bottlenecks and failures. In this blog, we will explore how distributed tracing works using an Order Service, Payment Service, Inventory Service, and Notification Service as examples.
Untracked Requests in Microservices
Initially, an order request moves through different services:
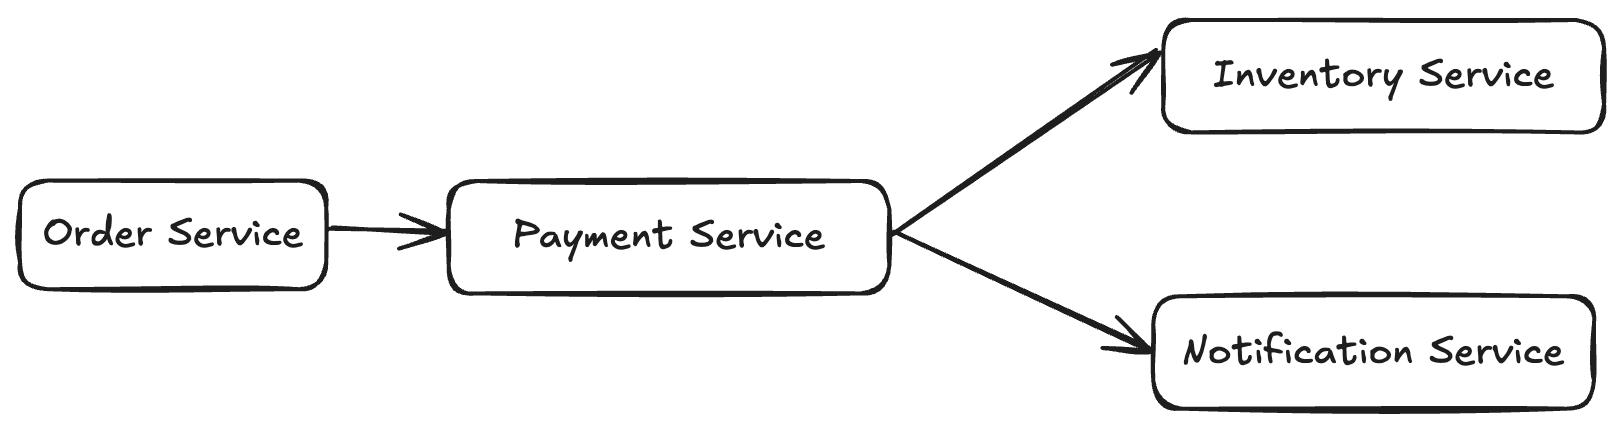
- The Order Service initiates the request.
- It calls the Payment Service to process the payment.
- The Payment Service interacts with the Inventory Service to check stock availability.
- It also notifies the Notification Service once the order is confirmed.
Issue: Without proper tracking, if a failure occurs (e.g., payment failure or inventory check issue), debugging becomes difficult. We wouldn't know where the request failed or how long each service took to respond.
Adding Request Identifiers (request_id)
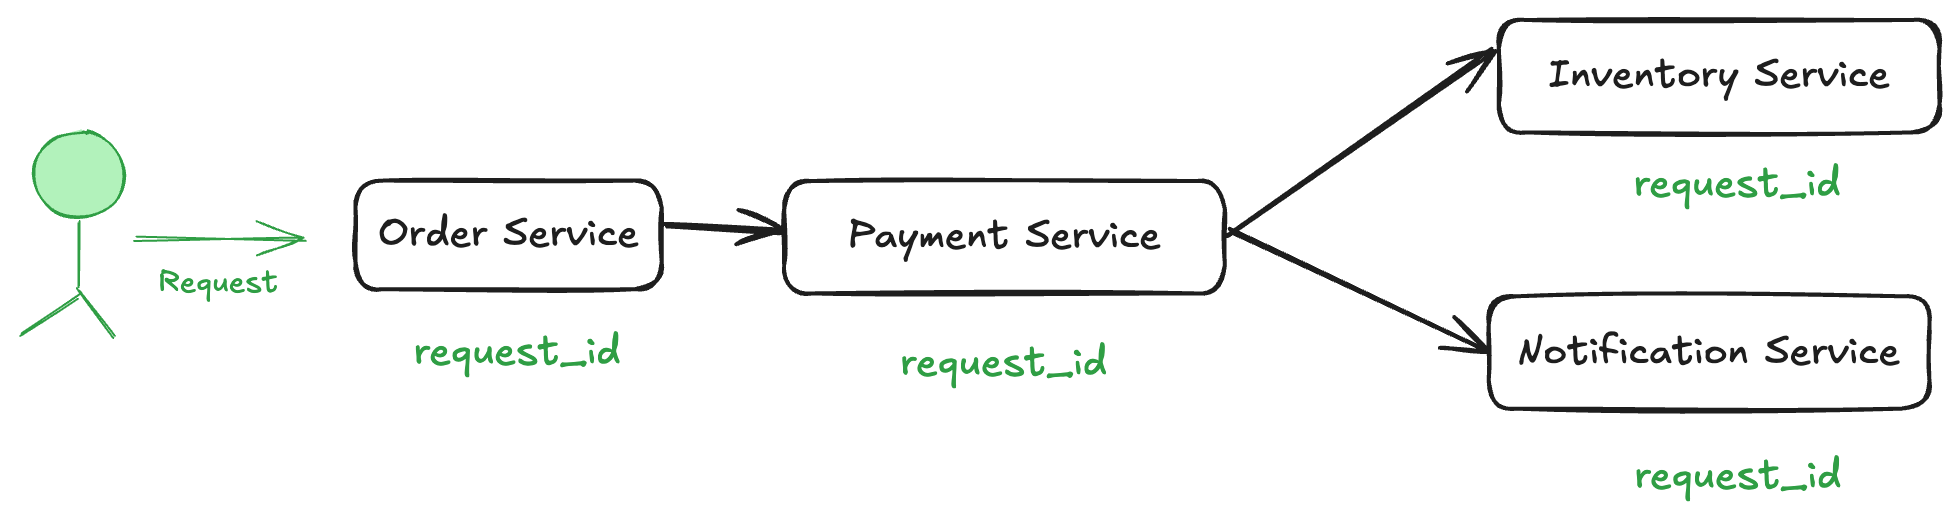
To address this, we introduce request identifiers (request_id) to track a request across services. Each request gets a unique request_id which is passed along all services.
Now, when a request is processed:
- The Order Service generates a
request_id. - The Payment Service, Inventory Service, and Notification Service receive the same
request_id.
🔍 Improvement: We can now track a specific request across services, making it easier to debug failures.
Implementing Distributed Tracing with trace_id and span_id
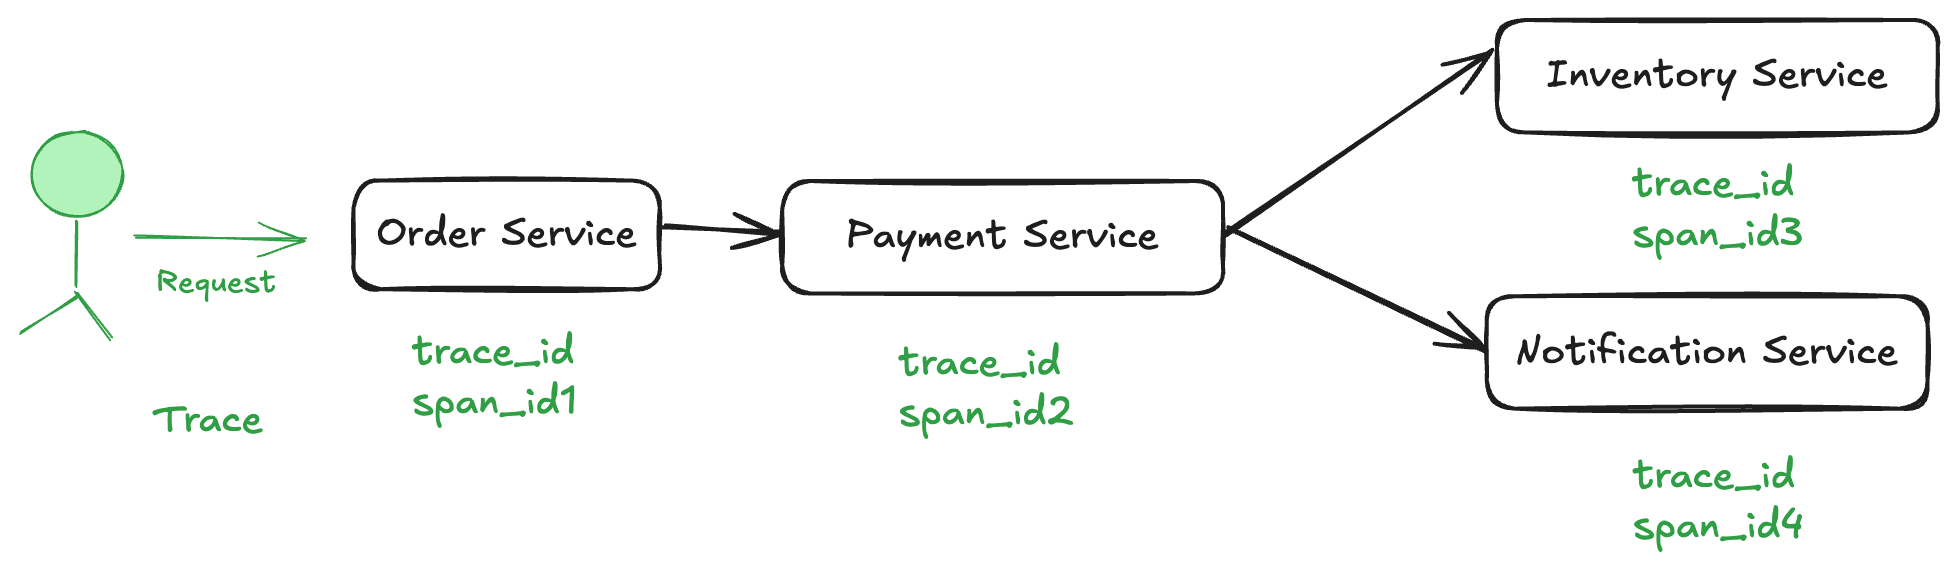
A request_id helps track the request, but we need more granular insights into each service’s execution time. This is where distributed tracing with trace_id and span_id comes into play.
- trace_id: A unique identifier for the entire request across all services.
- span_id: A unique identifier for each operation within a request.
Now, each service not only receives the trace_id but also generates a new span_id to track its individual execution time.
For example:
- The Order Service creates
trace_idandspan_id1. - The Payment Service gets the same
trace_idbut a newspan_id2. - The Inventory Service and Notification Service also create their own spans (
span_id3,span_id4).
🔍 Improvement: We now get detailed insights into which service took how long, making it easier to identify bottlenecks.
Tracing Requests End-to-End
Finally, distributed tracing tools like Jaeger or OpenTelemetry collect and visualize all spans under a single trace_id. This allows us to see:
-
The complete request lifecycle.
-
Execution time for each service.
-
Where failures or slowdowns occur.
Outcome: We now have end-to-end observability of the request, making debugging and performance monitoring much more effective.
Conclusion
Distributed tracing is a game-changer for microservices. By implementing trace_id and span_id, we can:
- Track requests across multiple services.
- Identify slow services causing delays.
- Debug failures quickly with full request visibility.
Sample Output:
[Order Service] Trace ID: abc123, Span ID: span_001, Execution Time: 120ms
[Payment Service] Trace ID: abc123, Span ID: span_002, Execution Time: 95ms
[Inventory Service] Trace ID: abc123, Span ID: span_003, Execution Time: 60ms